
| Type | Description | Contributor | Date |
|---|---|---|---|
| Post created | Pocketful Team | Jun-29-24 | |
| Addn new links | Nisha | Mar-18-25 |
Read Next![]()
- MCX Trading: What is it? MCX Meaning, Features & More
- Top 10 Intraday Trading Strategies & Tips for Beginners
- How to Use Pivot Points in Intraday Trading?
- What is Intraday Trading?
- Understanding Intraday Trading Timings
- How to Choose Stocks for Intraday the Right Way?
- Blending Candlestick Patterns: How It Works, Benefits & Drawbacks
- Market Order Vs Limit Order: What’s the Difference?
- Silver Futures Trading – Meaning, Benefits and Risks
- What is Crude Oil Trading and How Does it Work?
- Top Algorithmic Trading Strategies of 2025
- What is Paper Gold? – Meaning, Types, & Benefits
- What is Algo Trading?
- What is Tick Trading? Meaning & How Does it Work?
- Rising Window Candlestick Pattern
- Black Candle Pattern
- Piercing Pattern
- High-Wave Candlestick Chart Pattern
- Closing Black Marubozu Candle
- What is the Best Time Frame for Swing Trading?
What is Dow Theory? Meaning, Principles, and Examples
|
|

Dow Theory, a 100-year-old theory, is still valid in today’s volatile and technology-driven markets. Sounds interesting? Let’s find out.
Charles H. Dow is one of the pioneers in technical analysis and finance. Dow was the founder and first editor of The Wall Street Journal, co-founder of Dow Jones & Company, and a journalist. He used to record the highs and lows of the Dow Jones Industrial Average for daily, weekly, and monthly time frames to correlate the patterns. He tried to explain the historical events based on those patterns. He never published the complete theory before he died in 1902, but several followers and associates refined his work, including:
- William P. Hamilton published “The Stock Market Barometer” in 1922.
- Robert Rhea published “The Dow Theory” in 1932.
- E. George Schaefer published “How I Helped More Than 10,000 Investors to Profit in Stocks” in 1960.
- Richard Russell published “The Dow Theory Today” in 1961.
Even though Charles Dow is credited with developing the Dow Theory, S.A. Nelson and William Hamilton refined it into what it is today.
Dow Theory Explained
Dow theory supported the common belief that an asset price and its resulting movements already have all the necessary information reflected in it to make accurate predictions.
Based on his theory, Charles Dow created the Dow Jones Industrial Index and the Dow Jones Rail Index (now known as the Transportation Index), originally developed for the Wall Street Journal. Charles Dow created these stock indices as he believed they would accurately reflect the economic and financial conditions of companies in two major economic sectors: the industrial and the railway (transportation) sectors.
Principles of Dow Theory
Dow Theory is based on six principles, which are as follows:
- Market discounts everything: Dow believed that the prices of all the stocks and indices reflected all available information.
- Three-trend market: Three market trends are active at any given time that may be in opposite directions. Three trends are Primary, Secondary, and Minor. The primary trend is the largest trend that lasts for one year or more; it tells whether the market is bullish (going up) or bearish (going down). The secondary trend is often in the opposite direction of the primary trend; e.g., in a bull market, the secondary trend will give correction, and in a bear market, it will give a rally. The secondary trend lasts for a few weeks to a few months. Finally, there is a minor trend, which features short-term fluctuations and is unpredictable.
- Phases in Primary trend: There are three phases in the primary trend-
- Accumulation/Distribution phase: In the bull market, the accumulation phase witnesses an increase in price with an increase in volume. In bear markets, news of decline flows through the investors.
- Public participation phase: It witnesses the largest price movement because average and retail investors participate.
- Excess/Panic phase: In a bull market, it is called the excess phase (euphoria period) towards the end of the bull market, and experienced investors exit while the majority are buying. Similarly, investors continue selling aggressively in the panic phase at the end of the bear market.
- Volume must confirm the Primary trend: Volume should increase in the direction of the trend to confirm the primary trend. If the volume doesn’t increase in the direction of the trend, then it may signal weakness in the trend.
- Primary trends must confirm each other across other market indices: A trend in one index must be confirmed by a similar trend in other market indices. For example, Nifty and Banknifty cannot go in different directions for a longer timeframe or their primary trend.
- Primary trend remains in place until a clear reversal happens: This theory gives importance to a clear reversal of the primary trend, which may take several months. Hence, this theory may miss the early signs of reversals.
Example
Dow’s theory trading strategy is based on a trend-following strategy and can be either bullish or bearish. Remember, the trend is your friend, as per this theory.
Dow theory buy signal
This sequence should be followed for the buy signal :
- Once the low point of a downtrend is established, a secondary uptrend bounce will occur.
- A pullback in index or stock must exceed 3%, and it should not break prior lows; ideally, it should hold above the prior lows.
- A breakout above the previous rally high would generate a buy signal for the bull market.
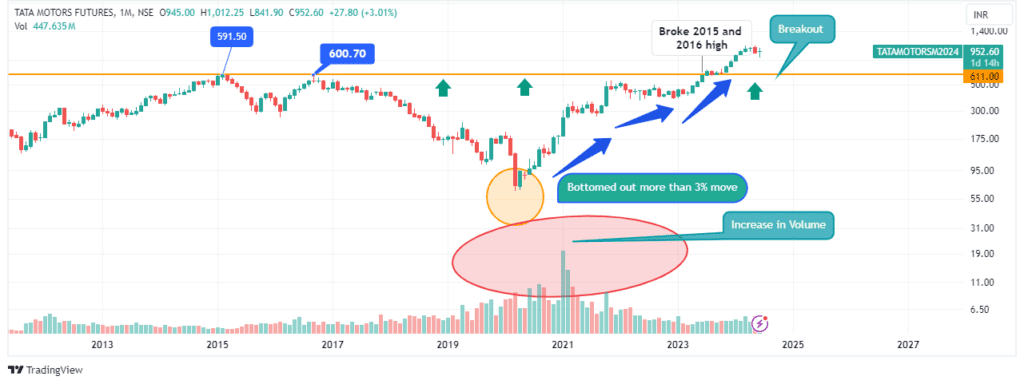
From the above chart of Tata Motors, we see it bottomed out with huge volumes on the monthly chart in May 2020, and then it started moving up in a primary trend. It gave a breakout in June 2023, broke a 2015 high of Rs.600, and went up to Rs.1050.
Dow Theory Sell Signal
This sequence should be followed for the sell signal :
- Index or stock tries to make tops and give pullbacks.
- Index or stock falls around 3% and doesn’t reach previous highs.
- A sell signal is triggered once it breaks the recent lows.
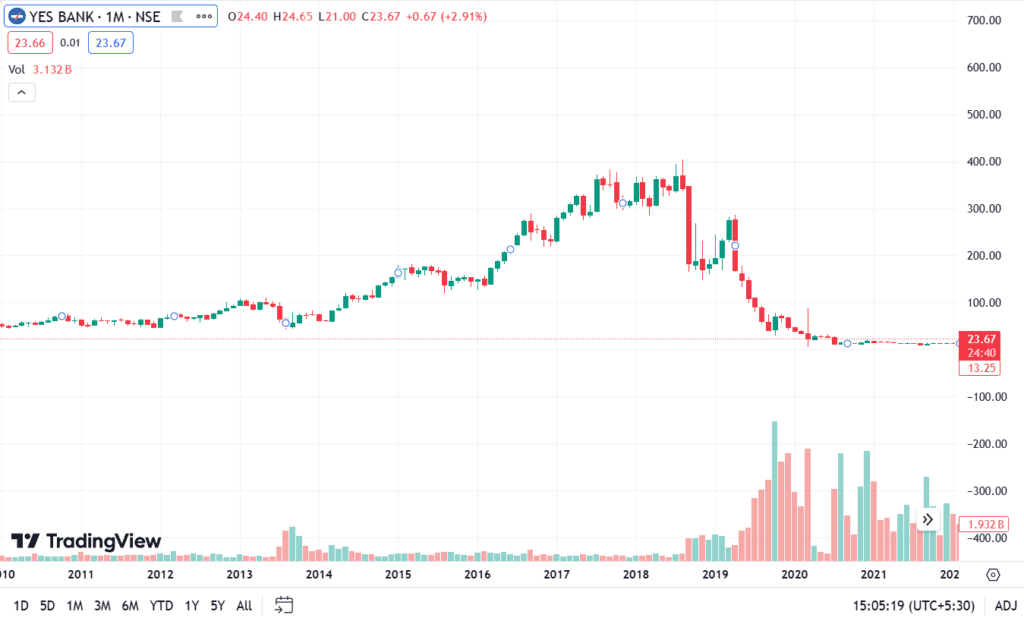
From the above chart of Yes Bank, we see monthly highs were around Rs. 400, and there were pullbacks. A sharp decline was seen, and the stock failed to reach previous highs. The stock broke the previous low alongside a volume rise, generating a sell signal. The stock currently trades around Rs. 24.
Read Also: How to use technical analysis on charts
Conclusion
Dow Theory is a 100-year-old theory, but its basic elements are still valid today. Charles Dow developed it, but William Hamilton and Robert Rhea further refined it. Dow Theory is a Bible for technical analysis and price action and explains the market philosophy. Many people think the market is different from when it started, but Robert Rhea’s book attests that the stock market behaves the same as it did 100 years ago. So, the basic philosophy covered in Dow Theory is still relevant.
Frequently Asked Questions (FAQs)
What is Dow Theory?
Dow Theory is about identifying trends and using certain parameters to confirm them.
Is it a theory?
Though it is popular, there were no academic papers related to it.
What is the goal of Dow Theory?
The goal is to identify the primary trend and then follow the trend to catch big moves.
What is one of the assumptions of Dow Theory?
The assumption is that the market discounts everything, which means the market reflects all available information.
Can it be used in Algorithmic Trading?
Yes, traders can program Dow’s Principles into algorithms; these algorithms can scan the market and look for patterns.
Disclaimer
The securities, funds, and strategies discussed in this blog are provided for informational purposes only. They do not represent endorsements or recommendations. Investors should conduct their own research and seek professional advice before making any investment decisions.