| Type | Description | Contributor | Date |
|---|---|---|---|
| Post created | Pocketful Team | Jul-15-24 | |
| Add new links | Nisha | Mar-18-25 |
Read Next![]()
- What Is Leverage in the Stock Market?
- Common Trading Mistakes Beginners Make (And How to Avoid Them)
- How to Pledge ETFs for Margin in India
- What Is Expiry Day Trading?
- Best ETF Platforms for Trading and Investment in India 2026
- What Is Strike Price in Options Trading?
- What is Speculative Trading?
- What is Revenge Trading?
- What Is Time Decay in Options?
- What are Candlestick Patterns? 38 Candlestick Patterns Every Trader Must Know
- How to Read Stock Charts: A Beginner’s Guide to Chart Analysis
- What is Gold Trading?
- Top Algo Trading Programming Languages in 2026
- What is Short-Term Trading Vs Long-Term Trading Strategies?
- NSE Algo Trading Rules for Retail Traders in India
- What is a Harami Candlestick Pattern?
- What is Average Traded Price in Stock Market
- What is MIS in Share Market?
- 7 Common Mistakes in Commodity Trading New Traders Must Avoid
- Brokerage Charges in India: Explained
What is Moving Averages?
Written by : Pocketful Team
|Updated by : Pocketful Team
Published on : 15th July 2024
|Updated on : 18th March 2025
Moving average may sound like a strange word, but it has a rather simple underlying concept. It is one of the most popular technical indicators to gauge market trends. Many seasoned investors follow the 200-day SMA and base their trading decisions on it.
In today’s blog, we will explore moving averages, their types, uses, and limitations with a real-world example.
What is Moving Averages?
Moving averages is a technical indicator that predicts the direction of trends by using time series data to create a series of averages. Moving averages smooth out short-term fluctuations and indicate long-term trends or cycles. Traders often use the 50-day or 200-day moving average to analyze stocks.
The term “moving” conveys that the moving average is calculated repeatedly using the latest data point. It appears as a line on the price chart, which continuously shifts once new price data becomes available. The moving average usually uses the closing prices of the asset and is a type of lagging indicator.
Types of Moving Averages
Moving averages can be calculated in a variety of ways, as listed below:
1. Simple Moving Average (SMA):
A Simple Moving Average is the arithmetic mean of a given set of closing prices of the asset over a specified period.
Simple Moving Average = ( P1 + P2 + P3 +⋯+ Pn )/ n
Where:
- P1, P2,…, Pn are the closing prices for each time period.
- N is the number of periods.
Example: For example, a 5-day SMA is calculated by adding the closing prices of a security for the last 5 days and then dividing by 5.
If the prices for 5 days are 10, 12, 14, 16, and 18, then SMA is:
SMA = (10 + 12 + 14 + 16 + 18) / 5 = 70 / 5 = 14
2. Exponential Moving Average (EMA):
This type of moving average gives more weight to recent prices, making it more sensitive to new information. The formula involves a smoothing factor, which usually depends on the length of the moving average.
EMA is calculated using the following formula:
EMA = Value today * Multiplier + EMA (previous day) * (1 – Multiplier)
where, Multiplier = Smoothing Factor / ( 1 + number of observations )
Example: For a 5-day EMA and a smoothing factor of 2,
Multiplier = 2 / (1 + 5) = 2 / 6 = 0.333
If the previous day’s EMA value is 13 and the current price is 18:
EMA = (18 × 0.333) + 13 * (1 – 0.333) = 5.994 + 8.671 = 14.665
3. Weighted Moving Average (WMA):
The Weighted Moving Average assigns a weight to each data point, with the most recent data points having higher weights.
WMA = ( Price 1 * n + Price 2 * (n-1) + … + Price n ) / (n * (n+1) / 2)
where n = number of observations
Example:If the prices are 20, 22, and 24, where 24 is the latest data point, and we want to calculate the 3-day WMA, we can do so as follows:
WMA= ( 24 * 3 + 22 * 2 + 20 * 1 )/ ((3 * (3 + 1) ) / 2) = 22.667
Example in Stock Trading
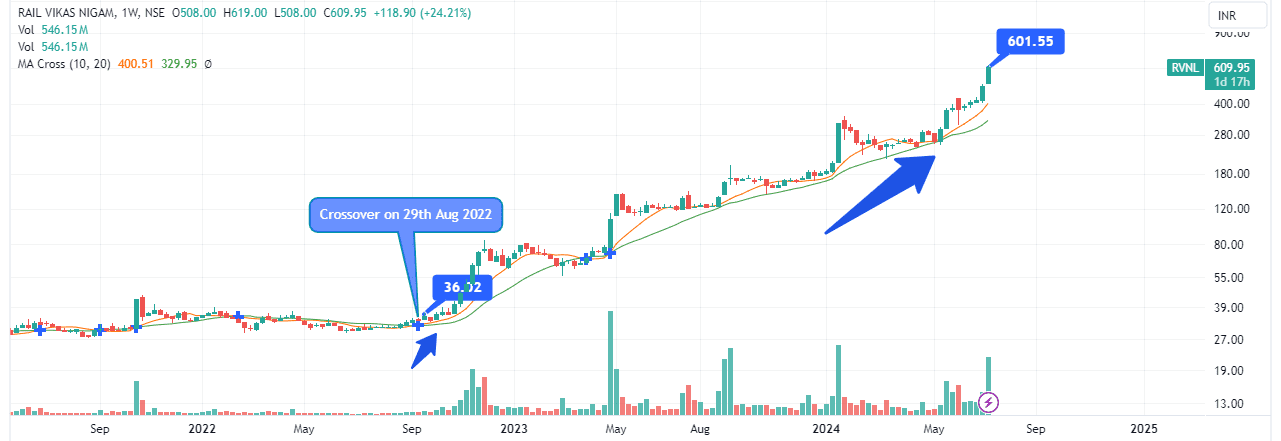
In stock trading, a seasoned trader generally uses a 50-day and 200-day moving average to implement a trading strategy. When the 50-day SMA crosses above the 200-day SMA, it generates a “golden cross,” which indicates a buy signal. Conversely, when the 50-day SMA crosses below the 200-day SMA, it generates a “death cross,” indicating a potential sell signal.
Let’s understand this with an example. Here, we have used 10-day SMA and 20-day SMA in the weekly chart of “Rail Vikas Nigam Ltd” or “RVNL”. On 29th August 2022, the 10-day SMA (Orange line) crossed above the 20-day SMA (Green line) when the stock price was INR 36. A buy signal was generated, and today, in July 2024, the price is around INR 600. Traders can exit once the 10-day SMA crosses below the 20-day SMA. In this case, a sell signal has not been generated in the past two years.
Uses of Moving Averages
Moving averages can be used for various purposes, as mentioned below:
- Average Price: Moving averages can be used to calculate average prices over a period, which helps traders identify the average price of a security over a given timeframe.
- Trend Identification: Moving averages help identify the direction of the trend. If the price is above the moving average, it suggests an uptrend; if it is below, it indicates a downtrend.
- Support and Resistance Levels: Moving averages can act as dynamic support and resistance levels. Prices often find support at the moving average during an uptrend and resistance during a downtrend.
- Convergence and Divergence: By comparing exponential moving averages with different time frames, traders can identify potential changes in trend strength. Convergence indicates that the trend is weakening, while divergence suggests a strengthening of the trend.
- Crossovers: A common trading strategy is the crossover technique to buy and sell. For example, a bullish signal is generated when a short-term moving average crosses above a long-term moving average, and a bearish signal is generated when it crosses below.
- Smoothing Data: Moving averages smooth out price data to create a single average line, which makes it easier to spot the direction of the trend.
- Risk Management: Moving averages can be used to set stop-loss levels. For example, a trader might place a stop-loss order near a moving average to protect against significant losses.
Limitation of Moving Averages
Limitations of moving averages are:
- Lagging Indicator: Moving averages are lagging indicators, meaning they are based on past prices and trends that may not reflect immediate current market conditions. This can lead to late entry or exit signals.
- Sensitivity to sudden price change: Moving averages can be overly sensitive to price shocks, which can lead to false signals and losses.
- Period selection: The effectiveness of moving averages depends on the selected time period. If the wrong period is selected, it could result in wrong signals and missed opportunities.
- Ignores other information: Moving averages don’t consider other important market factors such as volume, market sentiment, economic factors, news, etc., which can lead to inaccurate analysis.
- Less Predictive Power: As moving averages are based on historical data, they don’t have much predictive power.
- Over Dependence: Traders who solely rely on moving averages may miss out on other important aspects of technical analysis and risk management.
- False signal: In sideways or flat markets, moving averages can generate multiple false signals, leading to potential losses.
Read Also: Top Indicators Used By Intraday Traders In Scalping
Conclusion
In summary, moving averages are a powerful tool for trend identification and smoothing out price data, making them popular among traders and analysts. However, it is a lagging indicator and sensitive to false signals in volatile or flat markets, which means it should be used in conjunction with other technical analysis tools and market indicators to improve decision-making and reduce risks. Trading can be risky, so it is advised to consult a financial advisor before making any financial decision.
Frequently Asked Questions (FAQs)
01
What is the Moving Average?
It’s a statistical calculation used to analyze time series data by creating a series of averages.
02
How do moving averages help in trading?
It helps to identify trends and acts as support and resistance.
03
What is a moving average crossover?
Moving average crossover occurs when a short-term moving average line crosses a long-term moving average line from above or below.
04
Is there any right period for the moving average?
There is no right period to choose for a moving average; it depends on the time frame and trading strategy you are using.
05
Can moving average be used in any market?
Yes, it can be used in any type of market, such as equity, debt, commodity, or currency.
Disclaimer
The securities, funds, and strategies discussed in this blog are provided for informational purposes only. They do not represent endorsements or recommendations. Investors should conduct their own research and seek professional advice before making any investment decisions.
