
| Type | Description | Contributor | Date |
|---|---|---|---|
| Post created | Pocketful Team | Jul-24-24 | |
| Add new links | Nisha | Mar-18-25 |
Read Next![]()
- MCX Trading: What is it? MCX Meaning, Features & More
- Top 10 Intraday Trading Strategies & Tips for Beginners
- How to Use Pivot Points in Intraday Trading?
- What is Intraday Trading?
- Understanding Intraday Trading Timings
- How to Choose Stocks for Intraday the Right Way?
- Blending Candlestick Patterns: How It Works, Benefits & Drawbacks
- Market Order Vs Limit Order: What’s the Difference?
- Silver Futures Trading – Meaning, Benefits and Risks
- What is Crude Oil Trading and How Does it Work?
- Top Algorithmic Trading Strategies of 2025
- What is Paper Gold? – Meaning, Types, & Benefits
- What is Algo Trading?
- What is Tick Trading? Meaning & How Does it Work?
- Rising Window Candlestick Pattern
- Black Candle Pattern
- Piercing Pattern
- High-Wave Candlestick Chart Pattern
- Closing Black Marubozu Candle
- What is the Best Time Frame for Swing Trading?
Skewness and Kurtosis: Meaning, Types & Difference
|
|
Financial data available today requires a lot of processing before it can be used to get insights. Each dataset needs to be classified into a distribution that can be described using certain metrics. Two such metrics are skewness and kurtosis. Skewness and kurtosis are statistical measures used for data analysis. While skewness unveils asymmetry in data, kurtosis is all about decoding the tails of the distribution.
What is Skewness & Kurtosis?
Skewness measures the deviation of the given distribution of a random variable from a symmetric distribution. Skewness measures the asymmetry of the distribution.
Kurtosis is a statistical measure that describes the shape of a distribution’s tails relative to its overall shape. It indicates the presence and extent of outliers in the data by focusing on the tails and the peak. Kurtosis measures the “tailed ness” or the sharpness of the peak of the distribution.
Skewness – An Overview

Skewness is a measure of the asymmetry of the probability distribution of a real-valued random variable about its mean.
Skewness is important in statistical analysis because many statistical methods assume normality (symmetrical distribution). High values of skewness can indicate the presence of outliers and affect the validity of statistical tests. Understanding skewness helps in choosing appropriate statistical methods and data transformation techniques.
Types of Skewness:
- Positive Skewness (Right Skewed): The right tail (higher values) is longer, and the mass of the distribution is concentrated on the left. The condition for positive skewness is Mean> Median>Mode.
- Negative Skewness (Left Skewed): The left tail (lower values) is longer, and the mass of the distribution is concentrated on the right. The condition for negative skewness is Mode>Median>Mean.
- Zero Skewness (Symmetrical Distribution): The distribution is perfectly symmetrical. The condition for zero skewness is Mean=Median=Mode.
Kurtosis – An Overview

Kurtosis is a statistical measure that defines how much the tails of a distribution differ from the tails of a normal distribution. It tells us about the presence of outliers in the data.
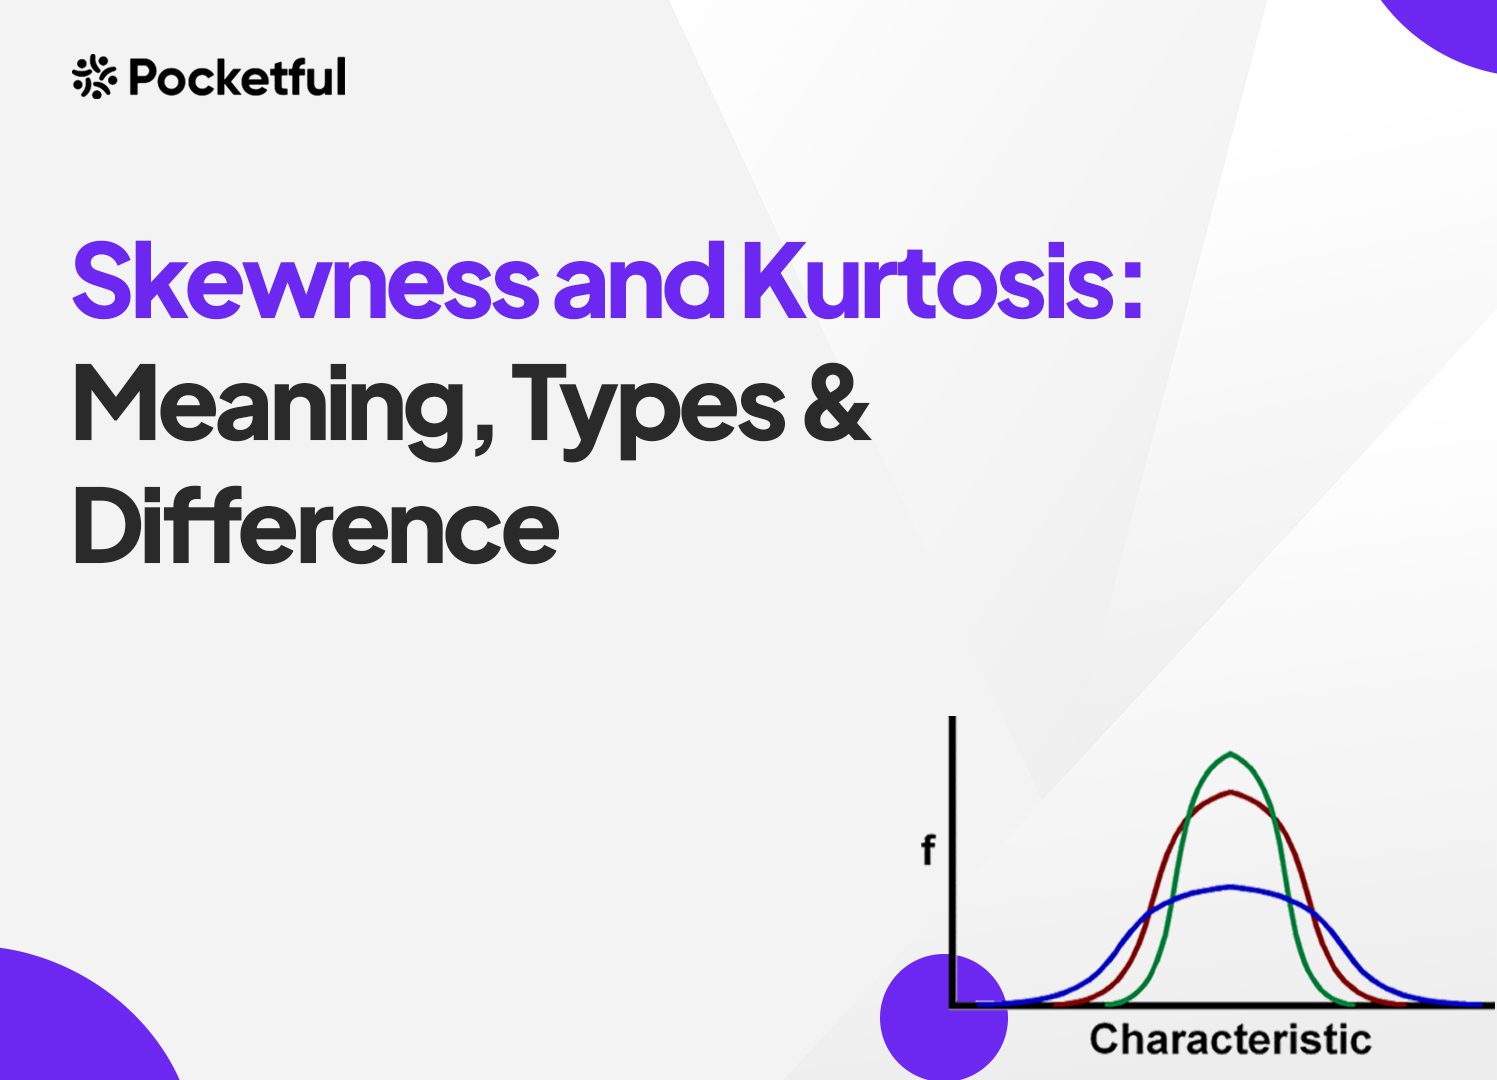
Types of Kurtosis :
- Leptokurtic (Kurtosis > 3): The distribution shows heavy tails, indicating more outliers and a sharp peak.
- Mesokurtic (Kurtosis = 3): The data follows a normal distribution, and kurtosis is equal to 3.
- Platykurtic (Kurtosis < 3): The distribution shows flat tails and a flat peak, indicating fewer outliers.
Application in Finance
In finance and investment analysis, skewness is an important statistical measure used to assess the asymmetry of the return distribution of assets, portfolios, or investment strategies. Here’s how skewness can be applied in this field:
1. Risk Assessment
Positive Skewness:
- Returns Distribution: A positively skewed distribution means that there are more frequent small losses and few large gains. Investors might prefer positively skewed assets because of the potential for high returns.
- Risk Perception: Positive skewness is often associated with assets that have a higher potential for extreme positive returns, making them attractive to risk-seeking investors.
Negative Skewness:
- Returns Distribution: A negatively skewed distribution means that there are more frequent small gains and few large losses. This can be more risky because large losses can significantly impact the portfolio.
- Risk Perception: Negative skewness is often associated with assets that have a higher potential for extreme negative returns, making them less attractive to risk-averse investors.
2. Portfolio Construction and Diversification
- Balancing Skewness: By understanding the skewness of individual assets, portfolio managers can construct diversified portfolios that balance the skewness. For instance, combining assets with positive and negative skewness can potentially reduce overall portfolio risk.
- Hedging Strategies: Identifying assets with negative skewness can help in designing hedging strategies to protect against large losses.
3. Performance Evaluation
- Comparing Investments: Investors can compare the skewness of different investments to understand their risk-return profiles better. Investments with similar expected returns but different skewness levels may have different risk characteristics.
- Understanding Outliers: Skewness helps in understanding the presence of outliers in the return distribution. For example, a positively skewed investment might experience occasional large gains, while a negatively skewed investment might experience occasional large losses.
5. Risk Management
- Stress Testing: Skewness is used in stress testing and scenario analysis to evaluate how extreme market conditions might impact the portfolio.
Difference Between Skewness and Kurtosis
| Skewness | Kurtosis |
|---|---|
| Skewness focuses on the asymmetry of the distribution. | Kurtosis focuses on the tails and the peak of the distribution. |
| Skewness indicates the direction (left or right) and the extent of asymmetry. | Kurtosis indicates the presence and extent of outliers by assessing the tails and peaks. |
| Value Interpretation:Positive value: Right skew.Negative value: Left skew.Zero value: Symmetrical distribution. | Value Interpretation:Value > 3: Leptokurtic (heavy tails).Value = 3: Mesokurtic (normal distribution).Value < 3: Platykurtic (light tails). |
Interpretation of Skewness and Kurtosis

Example – 1
Dataset A: 2,3,3,4,5,7,8,20
Skewness= 1.74, a positive value indicates a longer right tail.
Kurtosis = 5.17, higher than 3, indicating the presence of outliers.
Example – 2
Let’s consider an example involving the daily returns of two different investment funds: Fund A and Fund B.
Fund A: High Kurtosis (Leptokurtic)
Returns Dataset: −15%,−10%,−5%,0%,5%,10%,50%
Kurtosis Calculation: The returns of Fund A show a high kurtosis value (3.8), indicating a leptokurtic distribution. This means there are more frequent moderate returns and a higher likelihood of extreme positive or negative returns. It suggests that it is more prone to extreme events, both gains and losses. Investors in this fund should be prepared for high volatility and the possibility of significant outliers.
Fund B: Low Kurtosis (Platykurtic)
Returns Dataset: −2%,−1%,0%,1%,2%
Kurtosis Calculation: The returns of Fund B show a low kurtosis value ( -1.2), indicating a platykurtic distribution. This means there are fewer extreme values and more frequent returns close to the mean. Investors in this fund can expect lower volatility and fewer outliers.
Limitations of Skewness and Kurtosis
While skewness and kurtosis are valuable measures in statistical analysis, they also have limitations that should be considered when interpreting data.
Limitations of Skewness
The limitations of skewness are:
- Sensitivity to Outliers: Skewness can be highly sensitive to outliers. A few extreme values can significantly affect the skewness value, which may not always represent the overall distribution accurately.
- Interpretation Complexity: Interpreting skewness coefficients requires understanding the context of the data. For example, positive skewness may not be problematic in certain financial data where higher values are expected.
- Not a Standalone Measure: Skewness alone cannot provide a complete picture of data distribution. It should be used in conjunction with other measures such as mean, median, and standard deviation.
- Symmetry Assumption: Skewness assumes an unimodal distribution (one peak). In bimodal or multimodal distributions, skewness might not be meaningful.
Limitations of Kurtosis
The limitations of kurtosis are:
- Misinterpretation of Tails: High kurtosis indicates heavy tails, but it does not specify whether the heavy tails are due to a few extreme outliers or a general spread of values. This can lead to misinterpretation.
- Focus on Tails: Kurtosis primarily focuses on the tails and peak of the distribution. It does not provide information about the overall shape or central tendency of the data.
- Non-Intuitive Interpretation: Kurtosis values can be difficult to interpret intuitively. While values greater than 3 indicate leptokurtic distributions and values less than 3 indicate platykurtic distributions, understanding the practical implications can be challenging.
- Assumption of Normality: Kurtosis comparisons are often made against the datasets with normal distribution. However, not all real-world data follow a normal distribution, making this comparison less meaningful in some contexts.
- Sensitivity to Sample Size: Kurtosis can be sensitive to sample size. Small sample sizes can produce unreliable kurtosis estimates, leading to potential misinterpretation.
Read Also: Understanding the Difference Between Credit and Debt
Conclusion
Skewness and kurtosis are complementary measures that provide a complete picture of the distribution characteristics of a dataset. Skewness tells us about the direction and degree of asymmetry, while kurtosis informs us about the tails and peaks, indicating the presence of outliers. They should not be used in isolation but rather as part of a comprehensive analysis that includes other statistical measures and visualizations. Understanding these limitations helps avoid potential misinterpretations and ensures a more accurate analysis of the data.
Frequently Asked Questions (FAQs)
Can skewness be zero?
Yes, skewness can be zero. This happens when the distribution is perfectly symmetrical.
How can skewness be used in investment analysis?
Skewness is used to measure the degree of asymmetry in returns on investment. For example, some portfolio managers prefer investments with a positively skewed return distribution, which means they may have frequent small losses or modest gains with a possibility of occasional large gains.
Can skewness be used in option trading?
Yes, skewness is particularly relevant in options trading. Traders can use the skewness of the return distribution of underlying assets to design strategies to take advantage of expected price movements.
What is one of the limitations of both skewness and kurtosis?
In complex distributions with multiple peaks or unusual shapes, these measures might not provide clear insights.
What is the relationship between kurtosis and volatility?
High kurtosis (leptokurtic) can indicate poor data quality due to the presence of outliers. Low kurtosis (platykurtic) suggests fewer outliers, which generally indicates better data quality.
Disclaimer
The securities, funds, and strategies discussed in this blog are provided for informational purposes only. They do not represent endorsements or recommendations. Investors should conduct their own research and seek professional advice before making any investment decisions.