| Type | Description | Contributor | Date |
|---|---|---|---|
| Post created | Pocketful Team | Jul-30-24 | |
| Add new links | Nisha | Mar-18-25 |
Read Next![]()
- What Is Leverage in the Stock Market?
- Common Trading Mistakes Beginners Make (And How to Avoid Them)
- How to Pledge ETFs for Margin in India
- What Is Expiry Day Trading?
- Best ETF Platforms for Trading and Investment in India 2026
- What Is Strike Price in Options Trading?
- What is Speculative Trading?
- What is Revenge Trading?
- What Is Time Decay in Options?
- What are Candlestick Patterns? 38 Candlestick Patterns Every Trader Must Know
- How to Read Stock Charts: A Beginner’s Guide to Chart Analysis
- What is Gold Trading?
- Top Algo Trading Programming Languages in 2026
- What is Short-Term Trading Vs Long-Term Trading Strategies?
- NSE Algo Trading Rules for Retail Traders in India
- What is a Harami Candlestick Pattern?
- What is Average Traded Price in Stock Market
- What is MIS in Share Market?
- 7 Common Mistakes in Commodity Trading New Traders Must Avoid
- Brokerage Charges in India: Explained
What is the Volatility Index (VIX)?
Written by : Pocketful Team
|Updated by : Pocketful Team
Published on : 30th July 2024
|Updated on : 18th March 2025
Financial markets are tough to navigate during times of high volatility. Do you know there is a metric investors use to gauge the volatility expected by the market participants in the near term? The volatility index, or VIX, is used to gauge the expected volatility in the market.
What is VIX?
VIX, or the Volatility Index, is a measure of the expected volatility in the stock market over the near term. India VIX is calculated through Nifty Index option prices and indicates the expected volatility over the next 30 days. It is modeled after the CBOE VIX (Volatility Index) in the United States. Here’s a detailed explanation:
The history of the Volatility Index (VIX) is closely tied to the development of the financial markets and the quantification of market risk and investor sentiment. Here is a brief overview of its history:
Origins and Development:
1. 1987 Stock Market Crash
- The stock market crash of 1987, also known as “Black Monday”, highlighted the need for better measures of market risk and volatility.
- This event spurred interest in developing a more systematic approach to quantifying market uncertainty.
2. 1993: Introduction of VIX
- The Chicago Board Options Exchange (CBOE) introduced the VIX in 1993.
- The original VIX was developed by Professor Robert Whaley and was based on the implied volatility of eight separate S&P 100 put and call options.
- This version of the VIX quickly became a widely followed indicator of market sentiment and expected volatility.
3. 2003: VIX Revision and Expansion
- In 2003, the CBOE updated the methodology to improve the accuracy and representativeness of the VIX.
- The new VIX was based on a broader range of options, specifically the S&P 500 (SPX) index options, including a wide range of strike prices.
- This new methodology provided a more accurate measure of market expectations for volatility over the next 30 days.
Significant Events
1. 2008 Financial Crisis:
- During the 2008 financial crisis, the VIX reached historically high levels, peaking at over 80 in November 2008.
- This spike reflected extreme fear and uncertainty in the markets as the global financial system faced unprecedented stress.
2. 2010 Flash Crash:
- On May 6, 2010, the VIX spiked sharply during the “Flash Crash”, a brief but severe market drop caused by high-frequency trading algorithms and other factors.
- During the crash, leading US stock indices, including the Dow Jones Industrial Average, S&P 500, and Nasdaq Composite Index, tumbled and partially rebounded in less than an hour. The day was distinguished by high volatility in the trading of all types of securities, including stocks, futures, options, and ETFs.
3. COVID-19 Pandemic:
- In March 2020, the VIX again reached extreme levels, surpassing 80 as the COVID-19 pandemic led to massive market sell-offs and economic uncertainty.
Formula of VIX
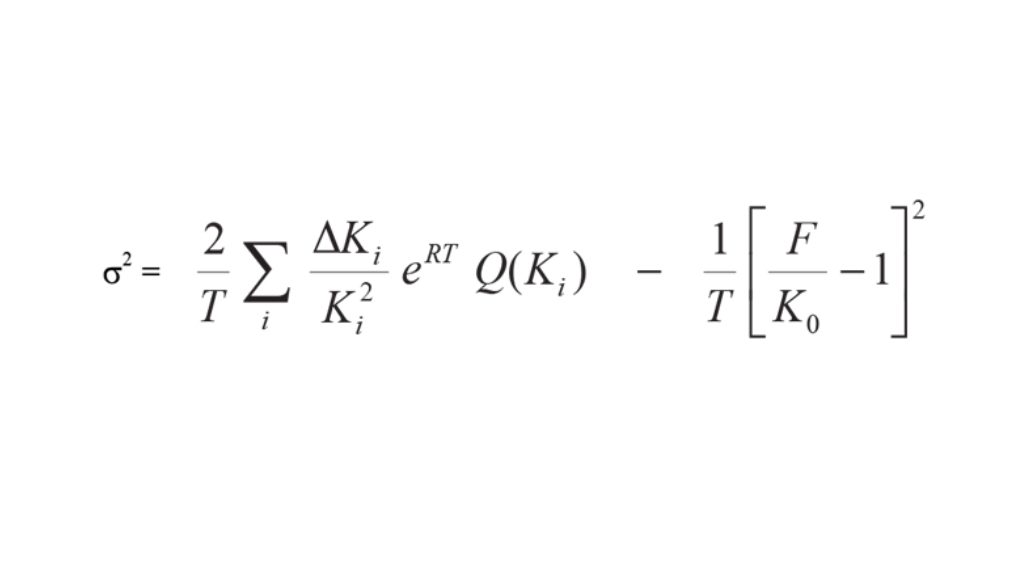
where,
T = Time to Expiration
F = Forward S&P 500 index level
Ki = Strike price of the ith OTM option
ΔKi = Interval between strikes
K0 = Strike price immediately below F
R = Risk-free interest rate
Q(Ki) = Midpoint of the bid-ask spread for each option with strike Ki
Interpretation of VIX
The volatility index has the following interpretations:
- High VIX: Indicates that investors expect higher volatility in the market. This often corresponds to periods of market stress, uncertainty, or potential downturns. It reflects investor fear and can suggest that the market might experience significant price swings.
- Low VIX: It suggests that investors expect stable market conditions with lower volatility. This typically corresponds to periods of market confidence and stability.
How to use VIX?
Vix can be used by investors in the following ways:
1. Risk Management:
- Investors and traders use VIX to gauge market sentiment and potential risks.
- It helps in making informed decisions regarding hedging strategies.
2. Trading Strategies:
- Traders may use VIX to develop strategies that profit from changes in volatility, such as trading VIX futures or options. VIX tends to revert to its mean over time. Extremely high or low values are usually temporary.
- It can also help in developing strategies involving index options. Some investors use the VIX as a contrarian indicator, buying when the VIX is high (implying fear) and selling when the VIX is low.
3. Market Analysis:
- Analysts use India VIX to understand the level of uncertainty or fear in the market.
- It provides insights into potential market movements and helps in predicting periods of high or low market activity.
Factors that influence the VIX
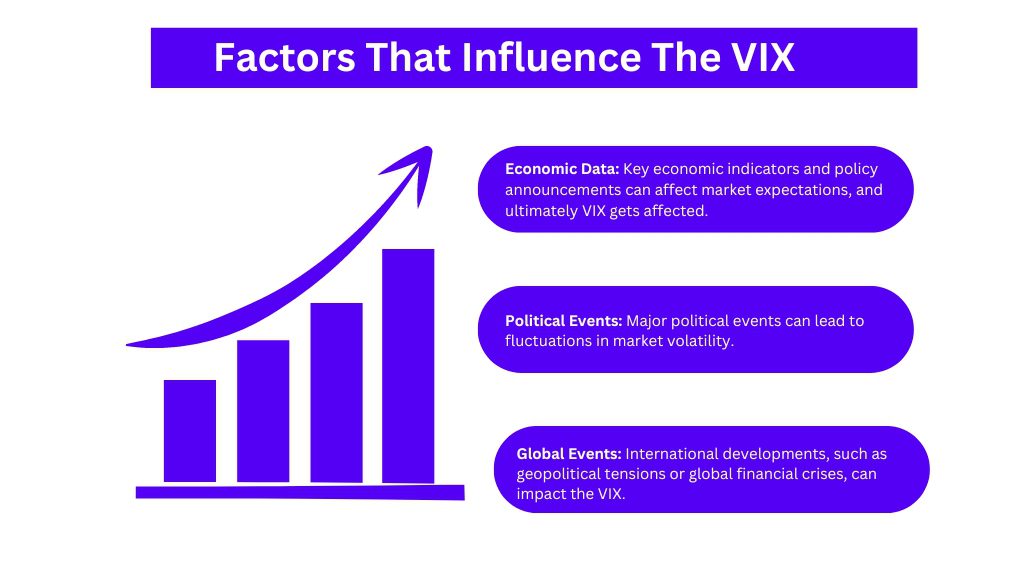
VIX can be influenced by the following factors:
- Economic Data: Key economic indicators and policy announcements can affect market expectations, and ultimately VIX gets affected.
- Political Events: Major political events can lead to fluctuations in market volatility.
- Global Events: International developments, such as geopolitical tensions or global financial crises, can impact the VIX.
Read Also: What is a Bid-Ask Spread?
Conclusion
The Volatility Index (VIX) is a measure of market expectations of volatility in the near future. The India VIX (Volatility Index) is a measure of market expectations of 30-day volatility in the NIFTY 50 index. It reflects investor sentiment and market risk by calculating the implied volatility of NIFTY options. India VIX is a crucial tool for market participants in India, helping them understand and manage the risk of their investments and gauge overall market sentiment. The India VIX measures expected volatility, not future market movements. While it provides insights into market sentiment and potential risk, it does not predict specific market directions or outcomes. Investors use the India VIX to assess the market risk and implement hedging and trading strategies in futures and options. However, it is advised to consult a financial advisor before making investment decisions.
Frequently Asked Questions (FAQs)
01
What is the India VIX?
The India VIX (Volatility Index) is a measure of market expectations of 30-day volatility in the NIFTY 50 index.
02
How often is the India VIX updated?
The India VIX is updated in real-time during market hours.
03
What are some factors that influence VIX?
Economic data releases and political and global events can influence VIX.
04
How does the India VIX compare to the CBOE VIX?
While the India VIX and the CBOE VIX both measure market volatility, the India VIX is based on NIFTY 50 options and is specific to the Indian market. The CBOE VIX, on the other hand, measures volatility for the S&P 500 index and is used globally.
05
How can I access India VIX data?
India VIX data is available on the National Stock Exchange (NSE) website and through various financial news platforms and trading terminals.
Disclaimer
The securities, funds, and strategies discussed in this blog are provided for informational purposes only. They do not represent endorsements or recommendations. Investors should conduct their own research and seek professional advice before making any investment decisions.
