| Type | Description | Contributor | Date |
|---|---|---|---|
| Post created | Pocketful Team | Apr-17-24 | |
| Add new links | Nisha | Apr-11-25 |

- Blog
- varun beverages case study
Varun Beverages Case Study: Business Model, Financials, and SWOT Analysis

Summer is knocking on the door, and the scorching heat is followed by the never-ending craving for soft drinks like Mountain Dew, 7up, Tropicana, etc.
While these brands belong to Pepsi, only some know their manufacturer, Varun Beverages. Today, we will explore VBL’s case study and analyze its business model and SWOT analysis.
Varun Beverages Company Overview
Varun Beverages Limited was established in 1995 by Ravi Jaipuria, the chairman of RJ Corp. The company primarily makes and distributes beverage bottles. The corporation was the first to set up bottling facilities in India for PepsiCo products. Outside of the United States, VBL is the second-biggest PepsiCo beverage bottling company globally. In 2016, the company conducted its initial public offering (IPO).
Business Model of Varun Beverages
The company’s primary activities include bottle manufacture and distribution of PepsiCo’s product line, which includes bottled water, juices, and other non-carbonated drinks in addition to carbonated soft drinks like Pepsi and Mountain Dew. The company and PepsiCo have a franchisee agreement that grants them the authority to manufacture and market PepsiCo beverages within their designated regions.
Based on PepsiCo’s stated framework, the company has limited flexibility in terms of marketing techniques and product advancements.
Revenue Model
VBL’s revenue strategy is pretty concentrated because it primarily makes money through a franchisee relationship with PepsiCo, for which it pays royalties and franchise fees. They supply wholesalers, distributors, and retailers with their final goods. In addition, it provides distribution services to PepsiCo and other beverage businesses, charging fees for shipping, warehousing, and logistics.
The company also earns a small portion of revenue from sponsorships, promotions, and advertisements.

Market Details of Varun Beverages
| Book Value | INR 49.94 |
| 52 Week High | INR 1561.95 |
| 52 Week Low | INR 687.5 |
| Face Value | INR 5 |
| TTM PE | 88.75 |
| Market Capitalization | 182,429 Crores |
Read Also: Amul Case Study, Business Model, And Marketing Strategy
Financial Highlights of Varun Beverages
Balance Sheet
| Particulars | 31st Dec 2023 | 31st Dec 2022 | 31st Dec 2021 |
|---|---|---|---|
| Non-Current Asset | 10951.553 | 8214.213 | 7035.777 |
| Current Asset | 4235.630 | 3404.030 | 2546.113 |
| Total Asset | 15187.183 | 11618.243 | 9581.890 |
| Equity | 7084.653 | 5215.487 | 4196.697 |
| Long Term Liability | 3949.318 | 2434.002 | 2364.947 |
| Current Liability | 4153.212 | 3968.754 | 3020.246 |
According to the data in the above table, the company’s long-term and short-term assets are growing year over year, but its long-term liabilities have also risen from 2,434 Crores in FY2022 to 3,949.32 Crores in FY2023.
Income Statement
| Particulars | 31st Dec 2023 | 31st Dec 2022 | 31st Dec 2021 |
|---|---|---|---|
| Revenue from operations | 16321.063 | 13390.558 | 8958.291 |
| Total Income | 16400.422 | 13429.407 | 9026.216 |
| Total Expenses | 13660.583 | 11405.764 | 8019.608 |
| Profit before tax | 2739.360 | 2023.637 | 1006.68 |
| Profit after tax | 2101.813 | 1550.114 | 746.052 |
The preceding table clearly shows that the company’s earnings and revenue are growing steadily. The company’s net profit has also increased by 35% year over year.
Cash Flow Statement
| Particulars | 31st Dec 2023 | 31st Dec 2022 | 31st Dec 2021 |
|---|---|---|---|
| Cash flow from operating activities | 2390.778 | 1790.029 | 1231.422 |
| Cash flow from investing activities | (3289.867) | (1704.598) | (1010.639) |
| Cash flow from financing activities | 984.9 | (17.942) | (177.682) |
The cash flow from financing activities exhibits massive growth, with inflows posting a positive figure of 984.9 Crores for FY 2023, whereas the cash flow from operating activities shows a steady rise.
KPIs
| Particulars | 31st March 2023 | 31st March 2022 | 31st March 2021 |
|---|---|---|---|
| Operating Profit Margin (%) | 18.74 | 16.77 | 13.5 |
| Net Profit Margin (%) | 13.10 | 11.76 | 8.45 |
| Return on Capital Employed (%) | 27.26 | 28.88 | 18.15 |
| Inventory Turnover | 3.39 | 3.73 | 3.09 |
| Current Ratio | 1.02 | 0.86 | 0.84 |
| Debt to Equity Ratio | 0.75 | 0.72 | 0.60 |
We can infer from the aforementioned KPIs that the company’s operational profit margins are increasing year over year, while their ROCE indicates steady growth. Additionally, their current ratio, a liquidity indicator, indicates a significant jump in liquidity when compared to FY 2022.
Read Also: Coca-Cola Case Study and Marketing Strategy
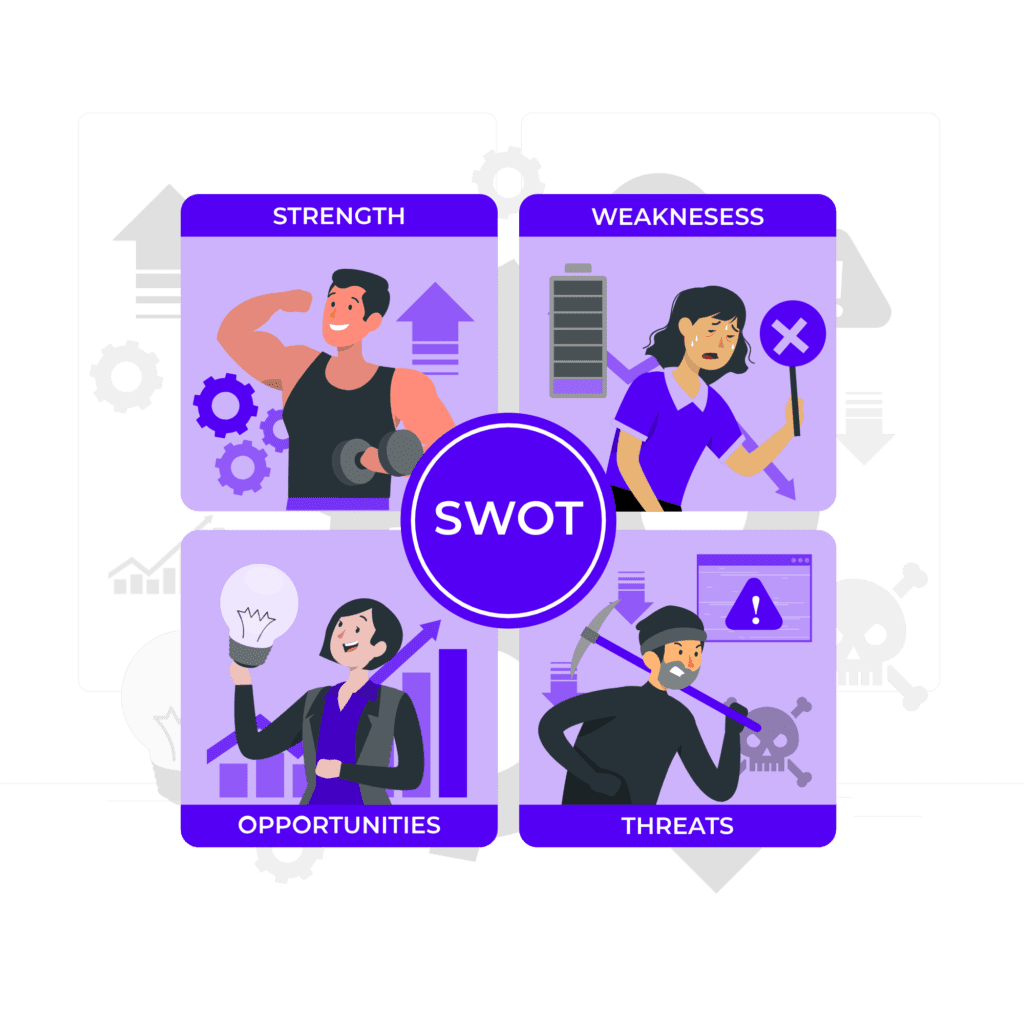
SWOT Analysis of Varun Beverages

Strengths
- They have an advantage over other market competitors because they are licensed to manufacture, distribute, and market well-known brands of PepsiCo.
- Due to its extensive geographic reach, they are less vulnerable to the economic fluctuations of any one region.
- They offer cost-effective products and have competitive pricing strategies because their management properly manages the production costs.
Weaknesses
- Since the business depends on PepsiCo for its products, any modifications to the agreement between the two will raise concerns for the business.
- PepsiCo’s product portfolio is restricted to carbonated drinks, which will raise their business risk. As a result, they must diversify their offerings.
- VBL’s beverages are a seasonal product, with summertime demand being the peak, which causes uneven revenue for the business in winters.
Opportunities
- The company can expand its business internationally by asking for new geographical licenses.
- The business must attract new customers by asking PepsiCo to change or modify their packaging of products.
- Companies can use the faster-growing e-commerce market to expand their online sales channel.
Threats
- The beverage industry is extremely competitive, with several well-known competitors like Coca-Cola and others.
- The organization must adapt to the changing consumer preference for healthy products and adjust its business strategies accordingly.
- The cost of raw materials, including sugar and plastics, is highly variable, and any change in pricing could have a detrimental effect on their profit margins.
- VBL’s product sales are entirely dependent on its supply chain and distribution network; any interruptions to these will result in a decline in sales.
Read Also: Zepto Case Study: Business Model, Financials, and SWOT Analysis
Conclusion
With its stronghold in the beverage business, Varun Beverages has made a name for itself. The company is positioned for long-term success thanks to its dedication to innovation, strategic growth, and customer satisfaction. Our never-ending desire for refreshing beverages will continue to be satiated because Varun Beverages regularly explores new product categories.
In addition, the business has increased its profits year over year and reported profits for the previous three years in a row. However, it is advisable to check your risk profile with your investment advisor and seek advice before making any investment decisions.
Frequently Asked Questions (FAQs)
How is Varun Beverages affiliated with PepsiCo?
PepsiCo has partnered with Varun Beverages to sell and distribute its products in the Indian Market.
How many Varun Beverages plants are there in India?
VBL has 31 manufacturing plants in India and 6 within international boundaries.
What famous products do Varun Beverages include?
VBL produces brands like Pepsi, Pepsi Black, Mountain Dew, Sting, 7-Up, Mirinda, etc.
Who owns Varun Beverages?
RJ Corp Limited owns Varun Beverages.
Who is Varun Beverages’ CEO?
Kapil Agarwal is the current CEO of Varun Beverages.
Disclaimer
The securities, funds, and strategies discussed in this blog are provided for informational purposes only. They do not represent endorsements or recommendations. Investors should conduct their own research and seek professional advice before making any investment decisions.