| Type | Description | Contributor | Date |
|---|---|---|---|
| Post created | Pocketful Team | Oct-18-23 | |
| FAQ and internal linking | Nisha | Feb-17-25 | |
| FAQ and internal linking | Nisha | Feb-17-25 |
Read Next![]()
- Why Are Steel Share Prices Increasing in India?
- Top Nifty Metal ETFs in India 2026
- Best Gold Investment Schemes in India 2026
- How to Build a Portfolio With Exchange-traded Funds (ETFs)
- How to Invest in US Stocks from India
- Platinum Price Forecast in India (2026–2030)
- Why Is the Gold Price Going Down?
- Top 10 BESS Stocks in India (2026)
- Why is the Silver Price Going Down?
- Best Construction Stocks in India
- Why Gold Prices Hit ₹1,80,000 – Key Reasons
- List of Best Sensex ETFs in India
- Best Commodities to Trade in India
- Best Cyclical Stocks in India 2026
- How to Check the Purity of 20-Carat Gold: Easy Methods & Tips
- Why Are Silver Prices Rising in India?
- Difference Between Hallmark Gold, KDM Gold and BIS 916
- Why Are Gold Prices Rising in India?
- 1 Tola Gold in India: How Many Grams, Price & Investment Insights
- 22K vs 24K Gold: Which Is Better for Jewellery & Investment?
What is ATR (Average True Range): Calculation, Advantages & Disadvantages Of ATR
Written by : Pocketful Team
|Updated by : Pocketful Team
Published on : 18th October 2023
|Updated on : 17th February 2025
In our previous blogs, we have discussed about stocks and technical analysis.
For reference, here are some insights into technical analysis.
Technical Analysis
Technical analysis is a method of analysing financial markets and making trading or investment decisions based on the historical price. It is primarily focused on studying past price movements and chart patterns to predict future price direction. Technical analysts identify support and resistance levels, which are price levels where an asset tends to find buying or selling pressure, respectively. Various technical indicators, including moving averages, Relative Strength Index (RSI) and Moving Average Convergence Divergence (MACD), provide quantitative measures of price momentum. The average true range is one such technical indicator. Let us go through an in-depth analysis of ATR.
What is ATR?
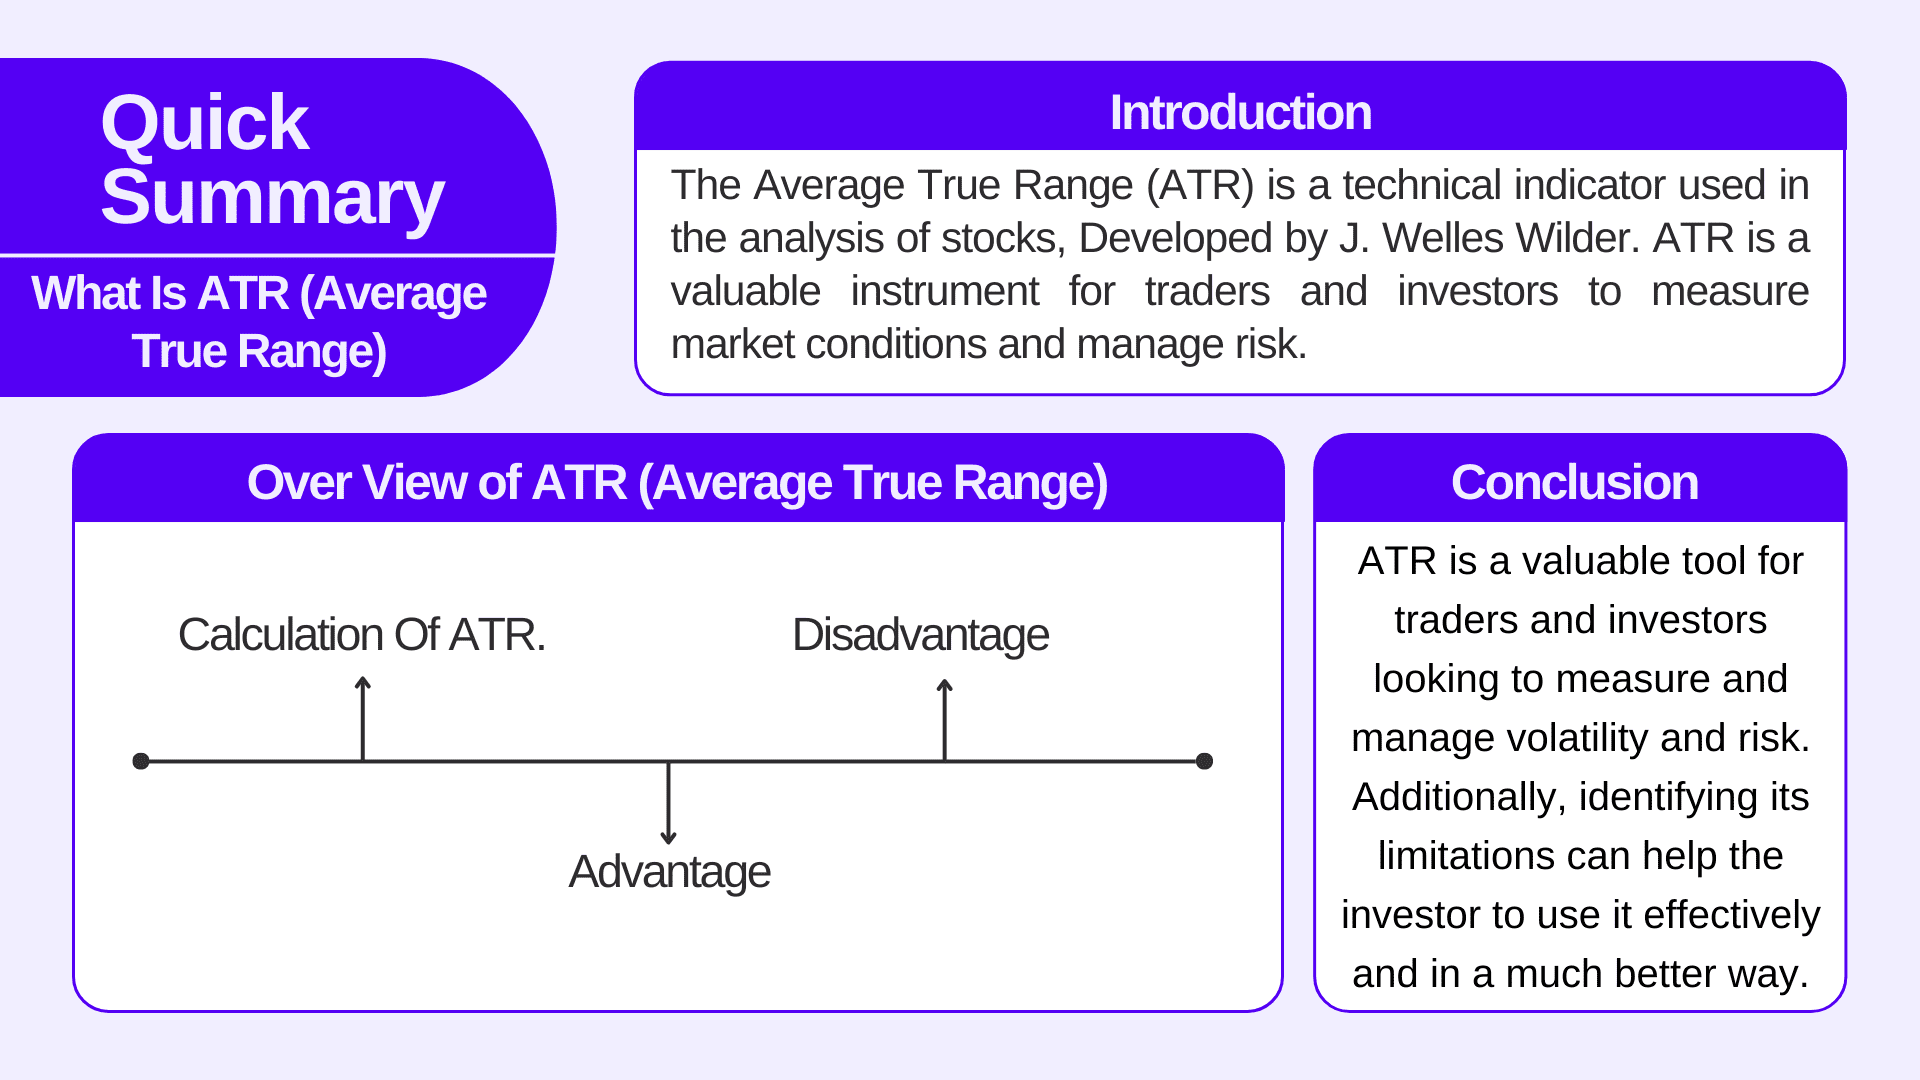
The Average True Range (ATR) is a technical indicator used in the analysis of stocks, primarily for estimating the volatility and price range of an asset. Developed by J. Welles Wilder in his book “New Concepts in Technical Trading Systems.” ATR is a valuable instrument for traders and investors to measure market conditions and manage risk.
Here are the key points about the Average True Range:
- The ATR is designed to measure the volatility of an asset, representing the average range between the daily high and low prices. A higher ATR value indicates greater volatility, while a lower value indicates lower volatility.
- The ATR is derived from the True Range, which is the greatest of the following three values:
- The current day’s high minus the current day’s low.
- The absolute value of the current day’s high minus the previous day’s close
- The absolute value of the current day’s low minus the previous day’s close.
- To calculate the Average True Range, a moving average is taken of the True Range values over a specified period. The most commonly used period is 14 days, but traders can adjust this period as per their preferences.
- Higher ATR values imply that the asset is going through greater price fluctuations, which can be understood as increased uncertainty or risk. Lower ATR values indicate relatively stable or less volatile market conditions.
- A rising ATR can confirm the strength of a trend, especially when in combination with other technical indicators. It suggests that the market is experiencing strong price movement.
- The choice of the ATR’s look-back period depends on the trader’s goals and time period. Shorter periods provide more responsive values, while longer periods offer a smoother, more stable measure of volatility.
The Average True Range is a multipurpose tool of technical analysis that when used in combination with other indicators and strategies can help in making informed trading decisions. It helps traders better analyse and manage the risks linked with market volatility, allowing for more precise stop-loss and position sizing.
Read Also: Best Options Trading Chart Patterns
Calculation of ATR.

The Average True Range (ATR) is calculated by following a specific formula. It involves several steps and the use of True Range values for a selected number of periods.
Here’s the formula and a step-by-step explanation of how to calculate the ATR:
Step 1:
Calculate True Range (TR)
True Range represents the greatest of the following three values for a given trading period.
- The difference between the current day’s high and the current day’s low.
(Current Day’s High – Current Day’s Low) - The absolute value of the difference between the current day’s high and the previous day’s close
(Current Day’s High – Previous Close) - The absolute value of the difference between the current day’s low and the previous day’s close. (Current Day’s Low – Previous Day’s Close)
Step 2:
Calculate the Average True Range (ATR)
The ATR is calculated as a moving average of True Range values over a specified number of periods (usually 14 days is the default period).
Here’s how to do it:
1. Select the number of periods (e.g., 14).
2. For the first True Range value (TR1), simply take the TR of the first period.
3. For the next ATR calculations, use the following formula:
- ATR = [(Prior ATR x 13) + Current TR] / 14
- Where “Prior ATR” is the ATR value calculated for the previous period, “Current TR” is the True Range value for the current period, and “14” represents the selected number of periods.
The process is repetitive for each subsequent period. Then continue to calculate the ATR by using the prior ATR and the current True Range.
Here’s an example to illustrate the calculation of the ATR:
Let’s say we want to calculate the 14-day ATR of a stock:
Day 1:
ATR1 = 2 (True Range for the first day)
Day 2:
ATR2 = [(2 x 13) + 4] / 14 = 2.07
Day 3:
ATR3 = [(2.07 x 13) + 3] / 14 = 2.01
Day 4:
ATR4 = [(2.01 x 13) + 6] / 14 = 2.06
The ATR value provides an indication of the average price range and volatility over the selected number of periods. Traders use it to assess the level of price volatility, set stop-loss levels, and determine position sizes based on their risk tolerance.
Advantages & Disadvantages Of ATR

The Average True Range (ATR) is a widely used technical indicator in trading and investing. Like most tools, it comes with its own set of advantages and limitations.
Here are the advantages and disadvantages of using the ATR:
Advantages of ATR:
- ATR is a purely mathematical indicator, which means it provides objective data. It’s not influenced by subjective opinions or emotions, making it a reliable tool for risk management.
- Traders can adjust the look-back period for the ATR to match their specific trading strategies and time horizons. Common periods include 14 days, but you can choose longer or shorter periods based on your needs.
- A rising ATR often indicates increased price volatility, which can confirm the strength of a trend. This is especially useful for trend-following traders.
Disadvantages of ATR:
- ATR is based on historical price data, and it doesn’t predict future price movements. It provides information about past volatility, which may not always reflect current or future market conditions.
- Like many technical indicators, the ATR is a lagging indicator, which means it reacts to price movements that have already occurred. This lag may limit its effectiveness in rapidly changing or highly volatile markets.
- ATR can generate false signals, especially in choppy or sideways markets. Traders need to use it in conjunction with other indicators or tools to minimize false signals.
- For beginners, the concept of ATR and its calculations can be complex. Understanding how to use ATR effectively may require some time and practice.
- ATR provides information on volatility but doesn’t offer insights into other important factors like trend direction, market sentiment, or the potential impact of news events.
Conclusion

To conclude, the ATR is a valuable tool for traders and investors looking to measure and manage volatility and risk. However, it’s essential to use it in combination with other indicators and analyse it carefully to create a comprehensive trading or investment strategy. Additionally, identifying its limitations can help the investor to use it effectively and in a much better way.
Read Also: Rising Window Candlestick Pattern
FAQs (Frequently Asked Questions)
01
What is the full form of ATR?
ATR stands for Average True Range.
02
What is prior ATR?
Prior ATR” is the ATR value calculated for the previous period.
03
Who developed ATR?
ATR was Developed by J. Welles Wilder in his book “New Concepts in Technical Trading Systems”.
04
What is the default period of true range for calculating ATR?
The default period of the true range for calculating ATR is 14 days.
05
Is ATR a leading or lagging indicator?
ATR is a lagging indicator.
Disclaimer
The securities, funds, and strategies discussed in this blog are provided for informational purposes only. They do not represent endorsements or recommendations. Investors should conduct their own research and seek professional advice before making any investment decisions.
