| Type | Description | Contributor | Date |
|---|---|---|---|
| Post created | Pocketful Team | Nov-15-23 | |
| Internal linking | Nisha | Feb-17-25 |
Read Next
- What is a Harami Candlestick Pattern?
- What is Average Traded Price in Stock Market
- What is MIS in Share Market?
- 7 Common Mistakes in Commodity Trading New Traders Must Avoid
- Brokerage Charges in India: Explained
- What is a BTST Trade?
- How to Do Algo Trading in India?
- What Is CMP in Stock Market?
- MTF Pledge vs Margin Pledge – Know the Differences
- Physical Settlement in Futures and Options
- List of Best Commodity ETFs in India
- Bullish Options Trading Strategies Explained for Beginners
- Best Brokers Offering Free Trading APIs in India
- Top Discount Brokers in India
- Best Charting Software for Trading in India
- Benefits of Intraday Trading
- What are Exchange Traded Derivatives?
- What is Margin Shortfall?
- What is Central Pivot Range (CPR) In Trading?
- Benefits of Algo Trading in India
- Blog
- what is gann box how to use meaning and strategy
What is Gann box: How to use, meaning and strategy

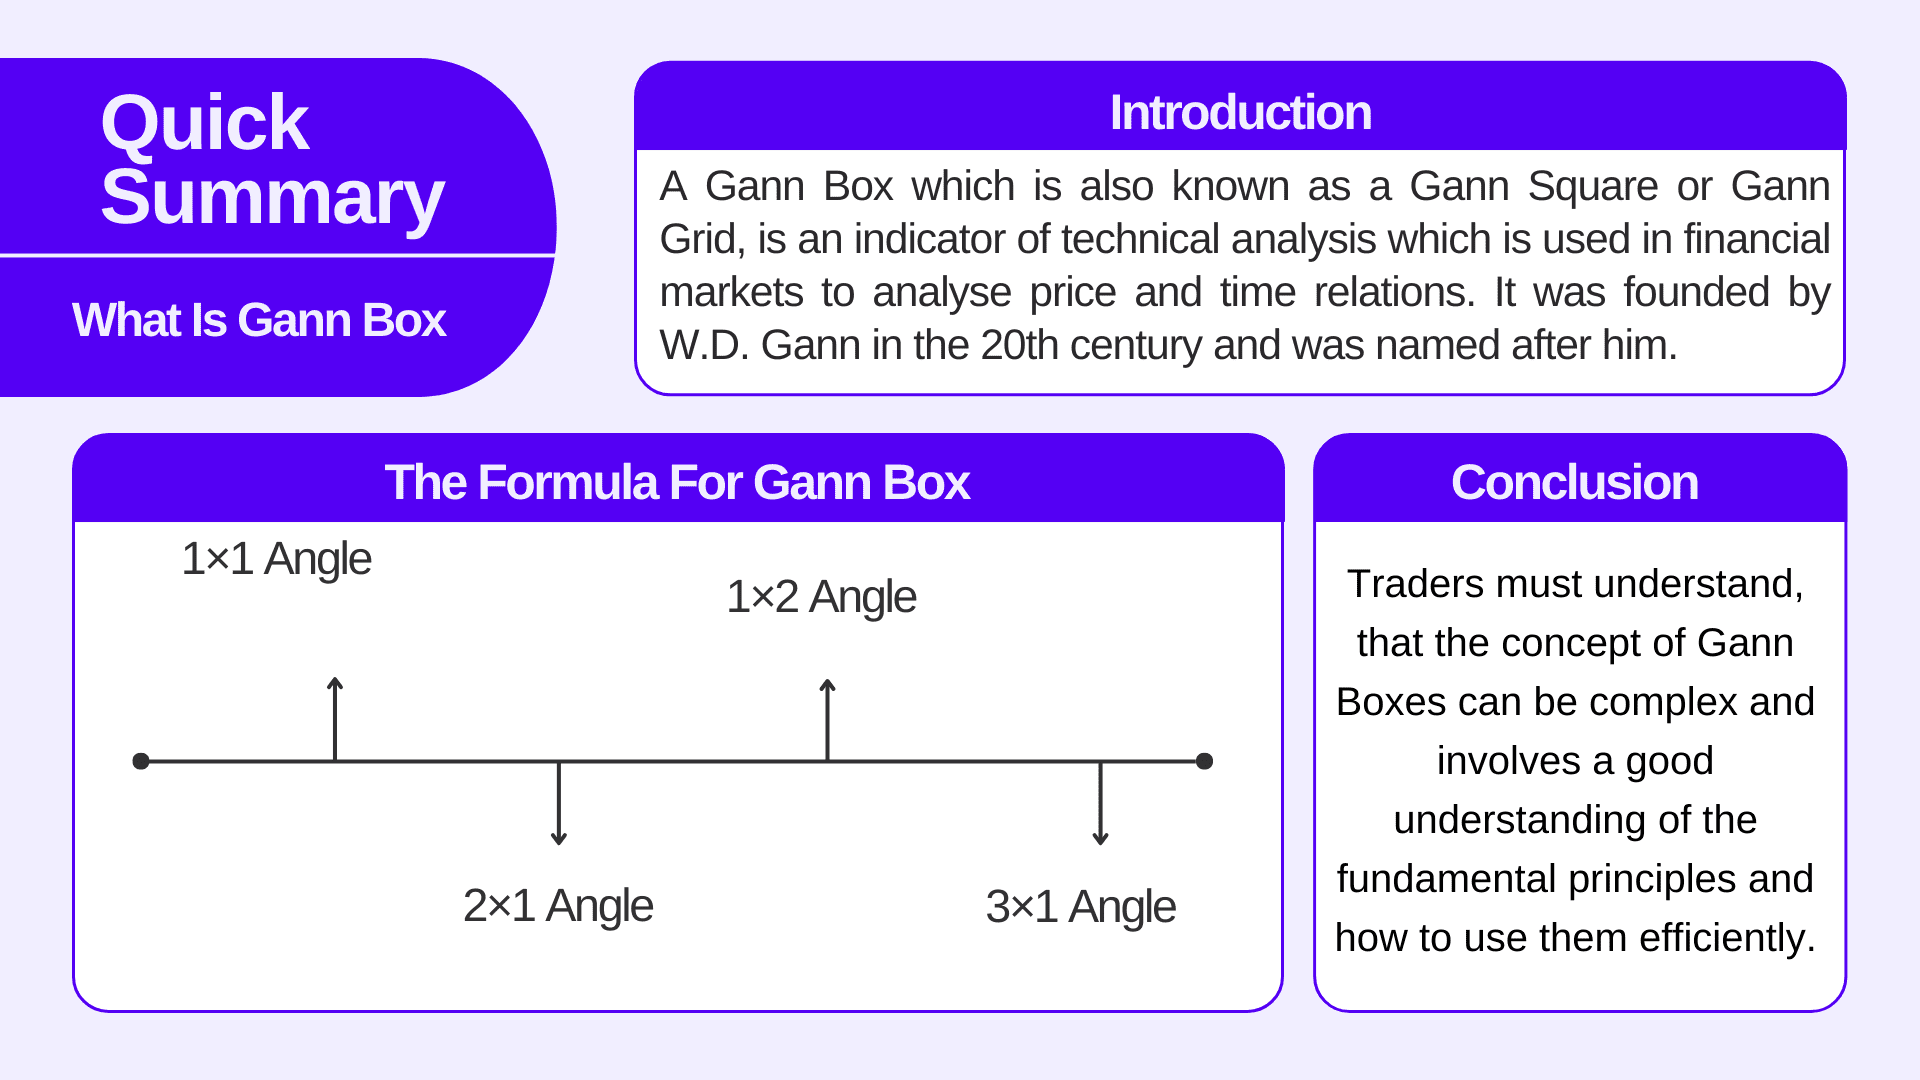
A Gann Box which is also known as a Gann Square or Gann Grid, is an indicator of which is used in financial markets to analyse price and time relations. It was founded by W.D. Gann in the 20th century and was named after him. He was a famous trader and analyst known for his innovative and inventive market analysis strategies. W.D. Gann observed that the market was cyclical and based on these ideologies he formed the Gann theories using various mathematical and geometrical concepts which included tools like Gann angles, Gann fans, Gann box and Gann squares of nine.
Gann square of nine is a circular chart, the Gann box is a series of diagonal lines and the Gann Fan consists of a series of angled lines, which are generally drawn from a pivot point on a price chart. In today’s blog, we will dive deep into the concept of the Gann box. The Gann Box studies price trends, support and resistance levels, and reversal points that are formed on candlestick charts. Here’s how a Gann Box works:

Construction of a Gann Box

A Gann Box contains a series of lines that are formed at certain angles and levels. These angles and levels are based on geometric principles and ratios which commonly include 45 degrees, 1×1, 2×1, 1×2, 3×1, and so on. The Gann box mainly comprises the following,
The 45-Degree Angle:
The main diagonal line in the Gann Box represents a 45-degree angle and is known as the 1×1 line.
Other Angles:
Additional diagonal lines are drawn at different angles, such as 2×1, 1×2, 3×1, and so on, and this completely depends upon the type of analysis being performed.
Uses of Gann Box:
Gann Boxes are used to identify and analyse trends in financial markets. The 45-degree angle represents a 1:1 relationship between price and time, so it can be used to identify the strength and direction of a trend.
The angles and lines in a Gann Box can be used as support and resistance levels. Traders look for price reactions at these levels to make trading decisions.
Gann Boxes are often used by traders to predict future price levels and the time that it might take to reach the price target.
Gann Boxes are used to identify potential reversal points in the market. Traders try to find the intersection of diagonal lines as a signal and assume that a reversal from the analysed price level is likely.
Some traders use Gann Boxes in combination with other technical analysis tools to identify geometric patterns and potential trading opportunities.
The formula for Gann Box
The formula for calculating other Gann Box angles involves ratios of price to time.
The important ratios used in Gann analysis are as follows:
1×1 Angle – Denotes a 1:1 relationship, which means that one unit of price change corresponds to one unit of time change.
2×1 Angle – Denotes a 2:1 relationship, which means that for every two units of price change, there is one unit of time change.
1×2 Angle – Denotes a 1:2 relationship, which means that for every one unit of price change, there are two units of time change.
3×1 Angle – Denotes a 3:1 relationship, meaning for every three units of price change, there is one unit of time change.
These lines create a grid on the price chart, and traders use them to identify potential support and resistance levels, time projections, and trend analysis.
Just like other indicators, Gann Box has its own set of advantages and disadvantages. Some of them are listed below
Advantages of Gann Box:

- Gann Boxes helps traders and investors to plan both time and price levels on a chart which eventually leads to a better and clearer understanding of support and resistance zones and prediction of future price movements of the stock market.
- Gann analysis is based on geometric and mathematical rules. The angles and lines drawn with Gann Boxes are exact and constant which provides traders with an organized and methodical approach to understand the prevailing trend of the market.
- Gann Box analysis can be used in combination with other technical and fundamental analysis techniques to expand a trader’s logical approach.
Disadvantages of Gann Box

- Gann Box analysis as a technical analysis tool can be highly subjective.
- Traders may take Gann angles and lines differently, which can lead to different conclusions about support and resistance levels or identification of trend directions.
- Gann analysis can be confusing at times, with multiple angles and lines on a candlestick chart. Traders may face difficulty in determining which lines are the most appropriate for a market time frame.
- Focusing and relying heavily on Gann angles can lead to missed opportunities or bad trading decisions.
- Rapid technological advancements and changes in market dynamics may limit the applicability of Gann analysis to modern trading environments.
Read Also: Price Action Analysis: An Easy Explainer
Conclusion

Traders must understand, that the concept of Gann Boxes can be complex and involves a good understanding of the fundamental principles and how to use them efficiently. The Gann box is a lesser-used tool of technical analysis since it includes mathematical calculations and is not as widely used as RSI, MACD and other indicators. Traders and analysts use Gann analysis in combination with other technical and fundamental analysis techniques to make more informed trading decisions.
FAQs (Frequently Answered Questions)
Is Gann Box a Leading or Lagging Indicator?
Gann Box is a lagging indicator.
Who founded Gann Box?
It was founded by W.D. Gann
What is the accuracy level of Gann Box?
Accuracy level of Gann Box is 92%
What is the most important angle of Gann Box?
The most important angle of the Gann box is 45 degrees.
What is Gann Fan?
Gann fan is a technical concept that consists of a series of diagonal lines that are drawn on a price chart to identify support and resistance levels.
Disclaimer
The securities, funds, and strategies discussed in this blog are provided for informational purposes only. They do not represent endorsements or recommendations. Investors should conduct their own research and seek professional advice before making any investment decisions.
Article History
Table of Contents
Toggle