| Type | Description | Contributor | Date |
|---|---|---|---|
| Post created | Pocketful Team | Oct-18-23 | |
| FAQ and internal linking | Nisha | Feb-17-25 |
Read Next![]()
- What Is Leverage in the Stock Market?
- Common Trading Mistakes Beginners Make (And How to Avoid Them)
- How to Pledge ETFs for Margin in India
- What Is Expiry Day Trading?
- Best ETF Platforms for Trading and Investment in India 2026
- What Is Strike Price in Options Trading?
- What is Speculative Trading?
- What is Revenge Trading?
- What Is Time Decay in Options?
- What are Candlestick Patterns? 38 Candlestick Patterns Every Trader Must Know
- How to Read Stock Charts: A Beginner’s Guide to Chart Analysis
- What is Gold Trading?
- Top Algo Trading Programming Languages in 2026
- What is Short-Term Trading Vs Long-Term Trading Strategies?
- NSE Algo Trading Rules for Retail Traders in India
- What is a Harami Candlestick Pattern?
- What is Average Traded Price in Stock Market
- What is MIS in Share Market?
- 7 Common Mistakes in Commodity Trading New Traders Must Avoid
- Brokerage Charges in India: Explained
What is MACD: Definition, Meaning, Uses and Strategy
Written by : Pocketful Team
|Updated by : Pocketful Team
Published on : 18th October 2023
|Updated on : 25th March 2025

What is MACD?

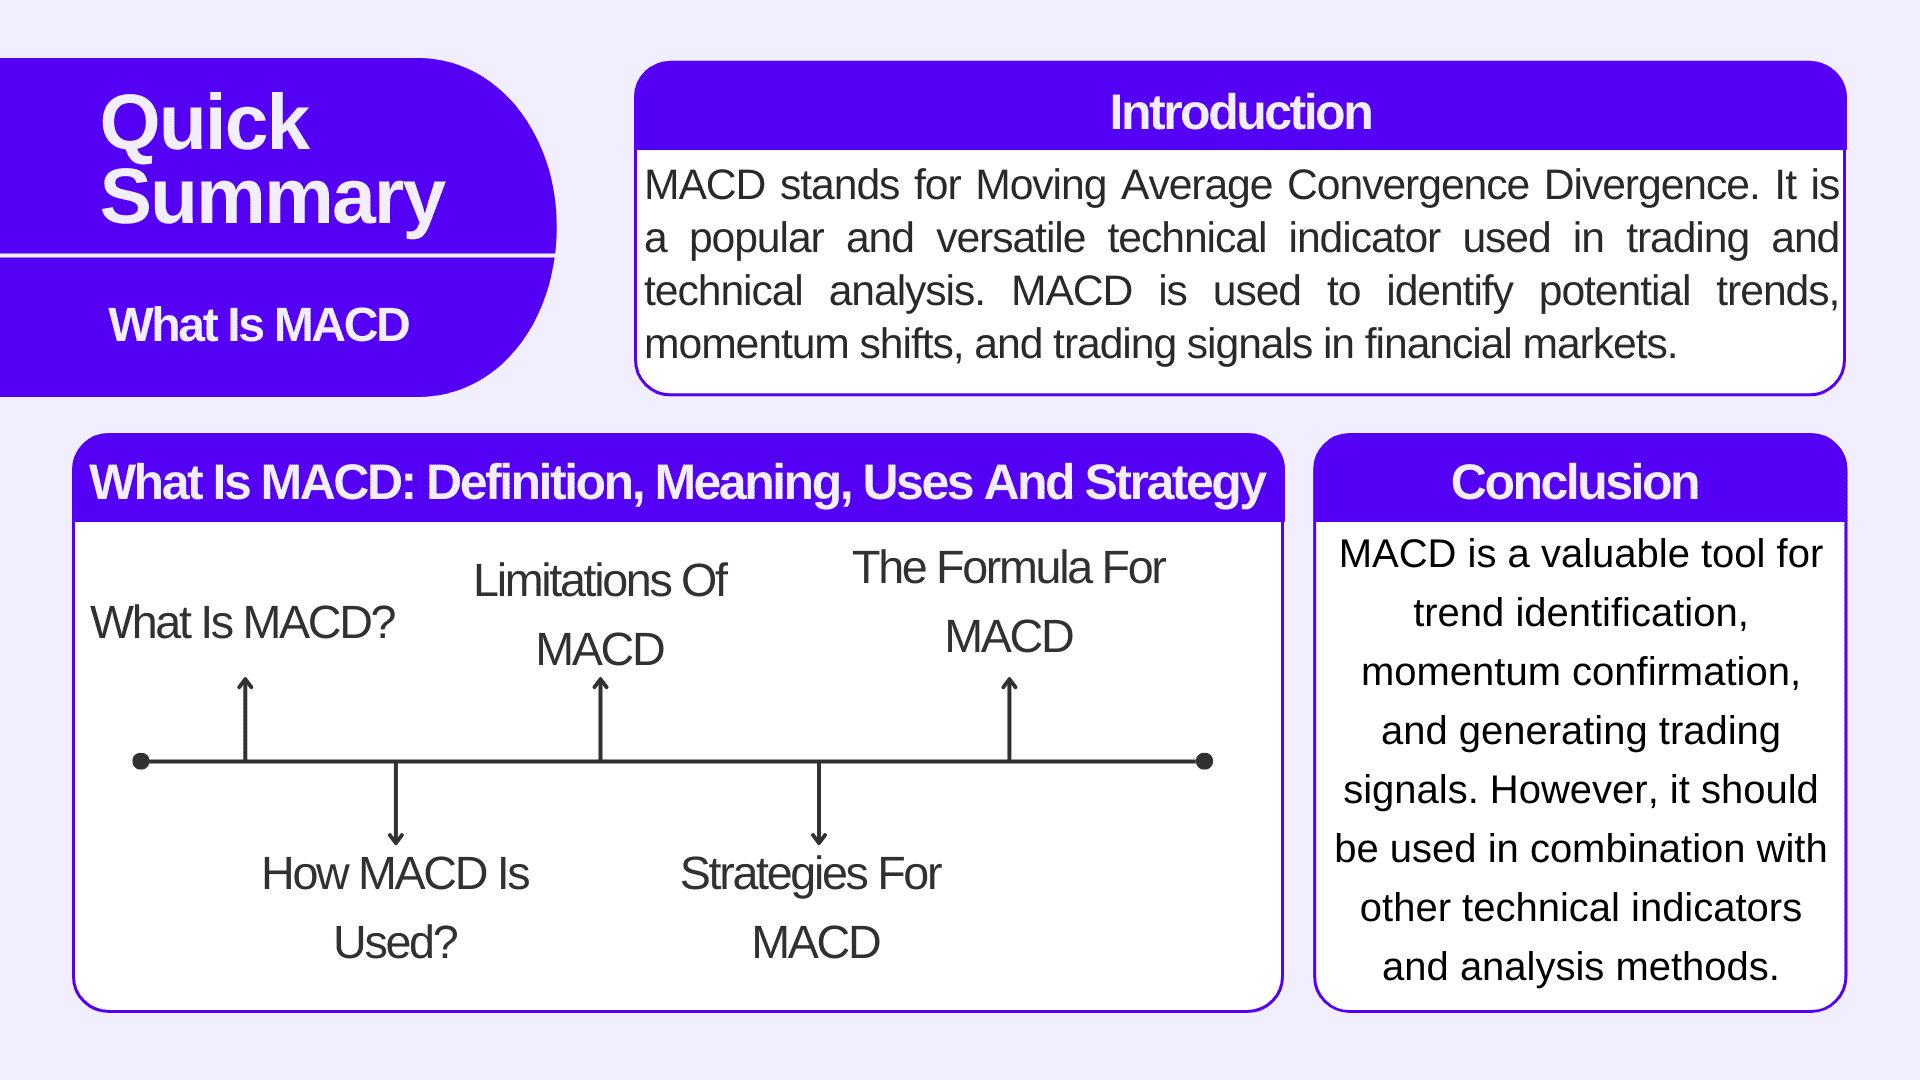
MACD stands for Moving Average Convergence Divergence. It is a popular and versatile technical indicator used in trading and technical analysis. MACD is used to identify potential trends, momentum shifts, and trading signals in financial markets, particularly in stocks, forex, and commodities. Here’s an overview of MACD and how it works:
The MACD indicator consists of three key components:
- The MACD line is the main component of the indicator. It is calculated by taking the difference between two Exponential Moving Averages (EMAs): a shorter-term EMA and a longer-term EMA. The most common settings are a 12-period EMA and a 26-period EMA. The MACD line represents the momentum of the stock’s price.
- The signal line is a 9-period EMA of the MACD line. It helps smooth out the MACD line and generate trading signals. When the MACD line crosses above the signal line, it may be a bullish signal, and when it crosses below, it may be a bearish signal.
- The MACD histogram is created by plotting the difference between the MACD line and the signal line. The histogram visually represents the convergence or divergence of the two lines. When the histogram is above the zero line and increasing, it indicates bullish momentum. When it is below the zero line and decreasing, it indicates bearish momentum.
The Moving Average Convergence Divergence (MACD) indicator was developed by Gerald Appel, an American trader and technical analyst. He introduced the MACD in the late 1970s and published it in his book “The Moving Average Convergence-Divergence Method” in 1979. The MACD has since become one of the most widely used and recognized technical indicators
Read Also: Moving Average Convergence Divergence, MACD
How MACD is used?

Traders and technical analysts use MACD in various ways to analyse price data and make trading decisions:
- When the MACD line is above the signal line and both are above the zero line, it indicates a potential bullish trend. On the contrary, when the MACD line is below the signal line and both are below the zero line, it suggests a potential bearish trend.
- Traders use MACD to confirm the strength of a trend. For example, if a stock is in an uptrend and the MACD is also rising, it represents strong bullish momentum.
- The divergence between the MACD line and the stock’s price can provide early signals of trend reversals. A bullish divergence occurs when the price is making lower lows, but the MACD makes higher lows. Bearish divergence is the
- MACD crossovers between the MACD line and the signal line can generate trading signals. A bullish crossover (MACD line crossing above the signal line) suggests a buy signal, while a bearish crossover (MACD line crossing below the signal line) suggests a sell signal.
- Traders often focus on the MACD histogram. Rising histograms indicate strong momentum in the current trend while falling histograms suggest weakening momentum.
- When the MACD line crosses above the zero line, it can indicate a shift from bearish to bullish momentum. On the other hand, a cross below the zero line can signal a shift from bullish to bearish momentum.
- MACD is a useful indicator that can be used in combination with other technical tools and techniques. It provides valuable insights into a stock’s trend, momentum, and trading opportunities. However, it is necessary to understand that no single indicator should be used in isolation, and traders should consider other factors and indicators when making trading or investing decisions.
Limitations of MACD

- MACD is a lagging indicator, which means it reacts to price movements that have already occurred. It may not provide timely signals in instantly changing or volatile markets.
- Like other technical indicators, MACD can generate false & fake signals, especially in choppy or consolidated markets. It’s important to use additional indicators or tools for confirmation of the trend.
- Quick reversals in price can result in false MACD crossovers and misleading signals.
- The MACD’s effectiveness is highly dependent on the choice of parameters, such as the number of periods for the EMAs. Different settings can result in different signals.
- MACD is solely based on price data and doesn’t consider fundamental factors. For a comprehensive analysis, combining it with fundamental analysis is sometimes necessary.
- The concept of MACD and its calculations can be complex for beginners. Understanding how to use MACD efficiently may require some time and practice.
Strategies for MACD
MACD Crossover Strategy
- Buy Signal:
When the MACD line crosses above the signal line, it generates a bullish (buy) signal. Traders often enter long positions at this point.
- Sell Signal:
When the MACD line crosses below the signal line, it generates a bearish (sell) signal. Traders often enter short positions at this point.
Zero Line Cross Strategy
- Buy Signal
When the MACD line crosses above the zero line, it indicates a shift from bearish to bullish price movement. This can be a buy signal.
- Sell Signal:
When the MACD line crosses below the zero line, it indicates a shift from bullish to bearish momentum. This can be a sell signal.
Other Strategies for MACD
Combine MACD with other technical indicators, such as support and resistance levels, moving averages, or chart patterns, for more robust trading signals.
Use MACD on multiple timeframes to confirm signals. For example, Traders may use a longer-term MACD on a daily chart to identify the primary trend and a shorter-term MACD on an hourly chart for entry and exit signals.
It’s essential to back-test any MACD strategy on historical data and use proper risk management. No single strategy works perfectly in all market conditions, so be prepared to adapt and refine your approach based on changing market dynamics. Additionally, consider combining MACD analysis with other forms of technical and fundamental analysis for a better trading strategy.
The formula for MACD
The Moving Average Convergence Divergence (MACD) is calculated using the following formula:
MACD Line (12-day EMA – 26-day EMA)
1. Calculate the 12-day Exponential Moving Average (EMA) of the stock’s closing prices.
2. Calculate the 26-day EMA of the stock’s closing prices.
3. Subtract the 26-day EMA from the 12-day EMA to get the MACD line.
(12-day EMA – 26-day EMA) = MACD line
Signal Line (9-day EMA of MACD Line)
- Calculate the 9-day EMA of the MACD line.
2. This 9-day EMA becomes the signal line.
MACD Histogram (MACD Line – Signal Line)
1. Subtract the signal line (9-day EMA of the MACD line) from the MACD line to get the MACD histogram. (MACD line – Signal line) = MACD Histogram
In summary, the MACD is derived by taking the difference between two Exponential Moving Averages (EMAs) of the stock’s closing prices. The MACD line is the primary component, while the signal line and the MACD histogram are derived from the MACD line.
Conclusion

To conclude, MACD is a valuable tool for trend identification, momentum confirmation, and generating trading signals. However, it should be used in combination with other technical indicators and analysis methods to improve signal quality and accuracy. Additionally, recognizing its limitations, that it is a lagging indicator and its sensitivity to parameters, is essential for informed trading decisions.
Also, read about mutual funds and ETF
FAQs (Frequently Asked Questions)
01
What is the full form of MACD?
MACD stands for Moving Average Convergence and Divergence.
02
Who developed MACD?
MACD was developed by Gerald Appel, an American trader.
03
Is MACD a leading or lagging indicator?
MACD is a lagging indicator.
04
Mention three components of MACD.
Three components of MACD are the MACD line, signal line and MACD histogram.
05
Why is MACD beneficial?
MACD helps us identify the strength of the momentum and the current trend of stock price.
Disclaimer
The securities, funds, and strategies discussed in this blog are provided for informational purposes only. They do not represent endorsements or recommendations. Investors should conduct their own research and seek professional advice before making any investment decisions.
